major_compact_zstd3
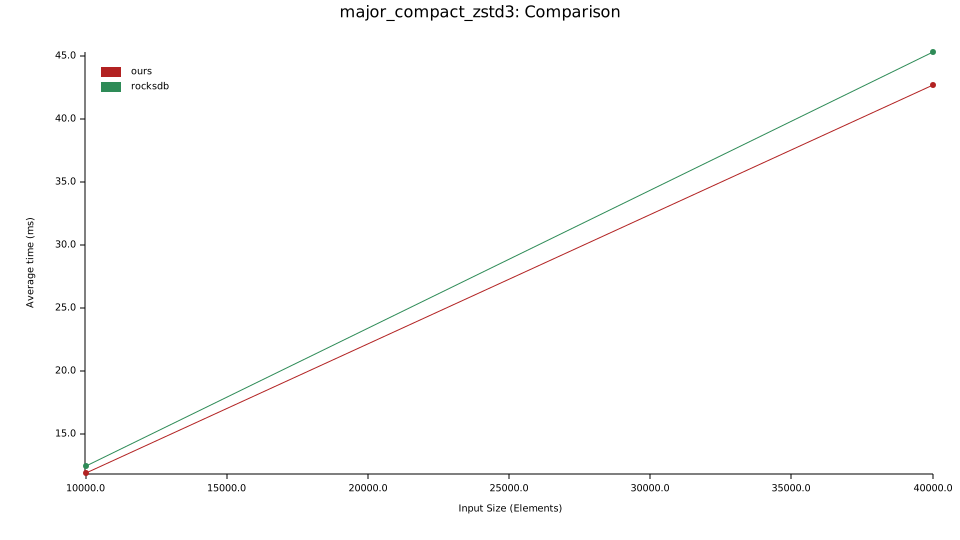
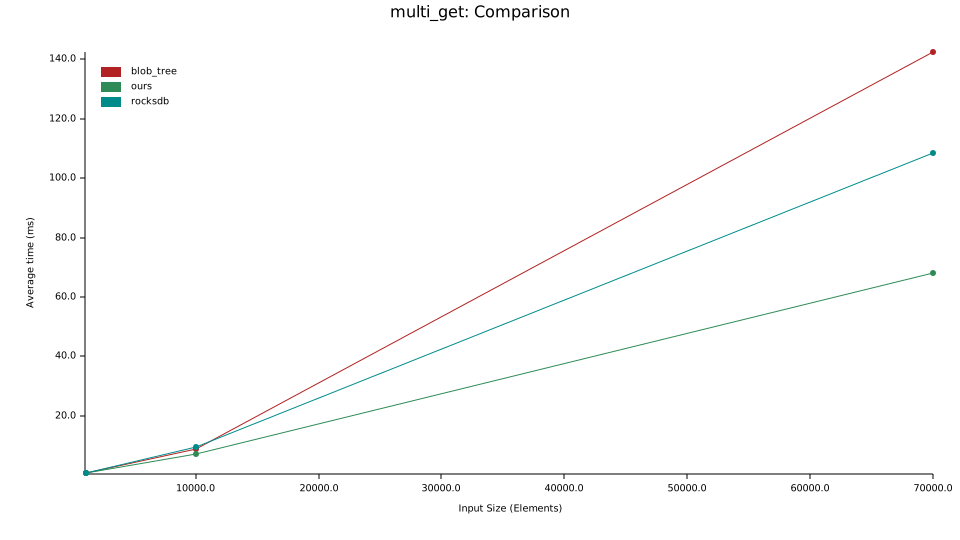
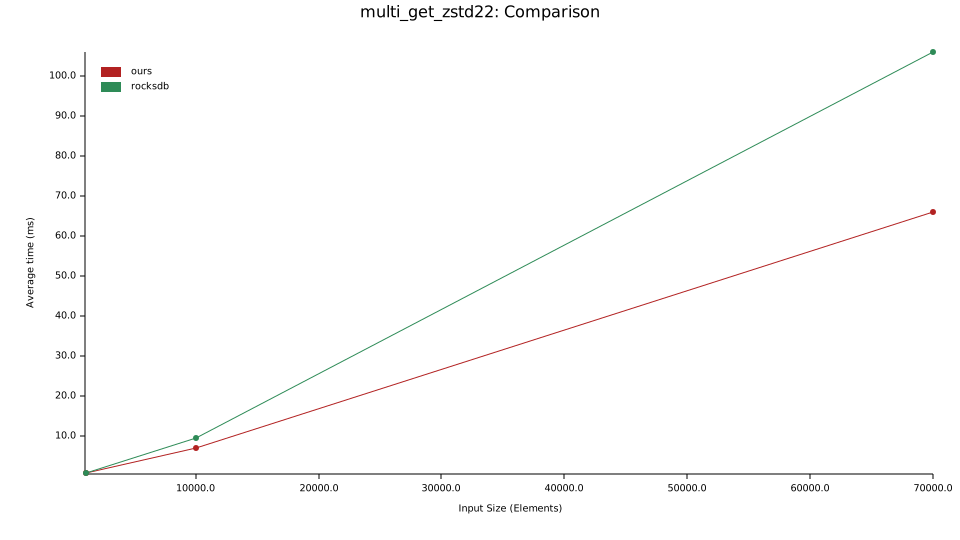
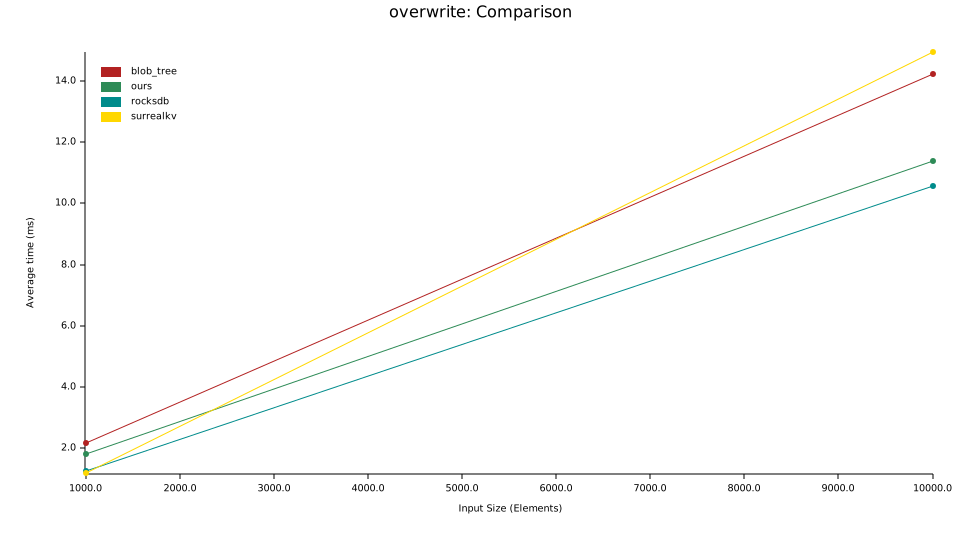
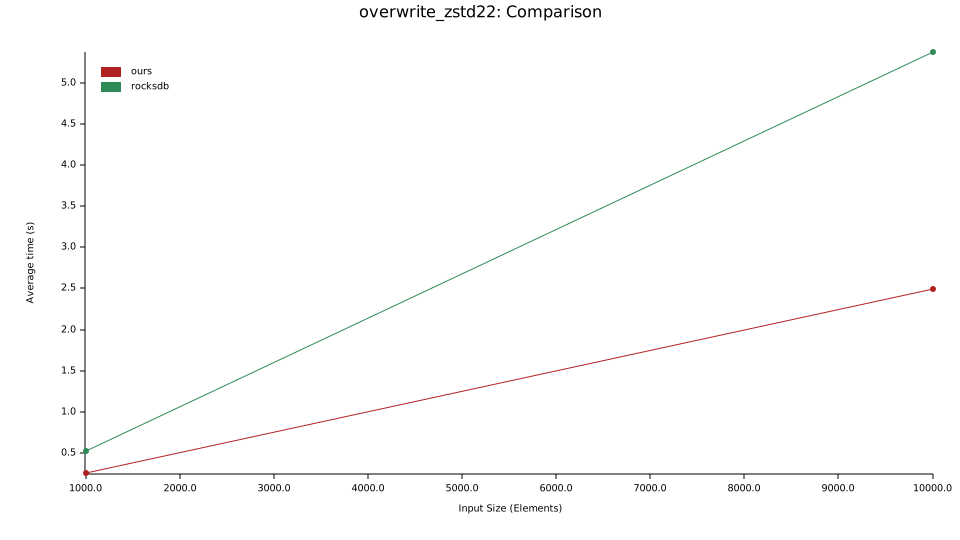
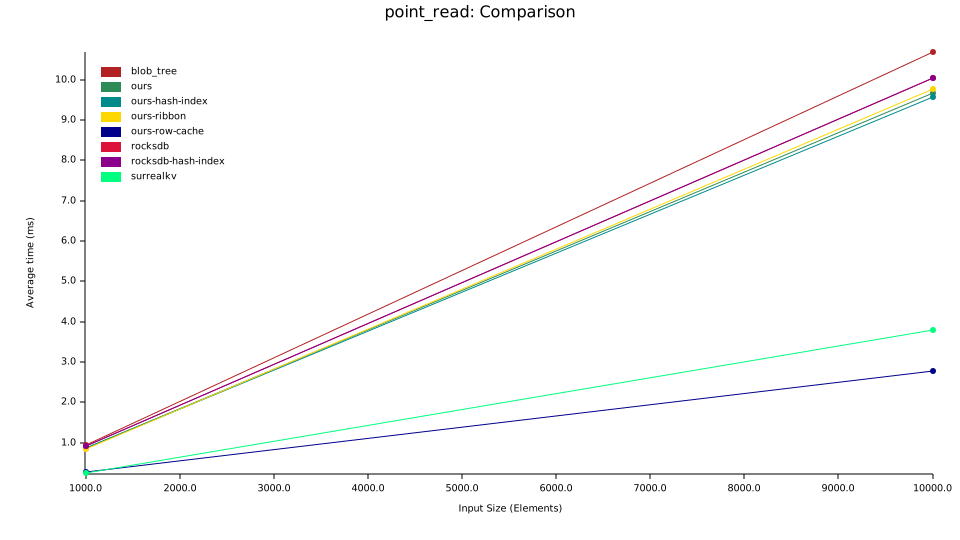
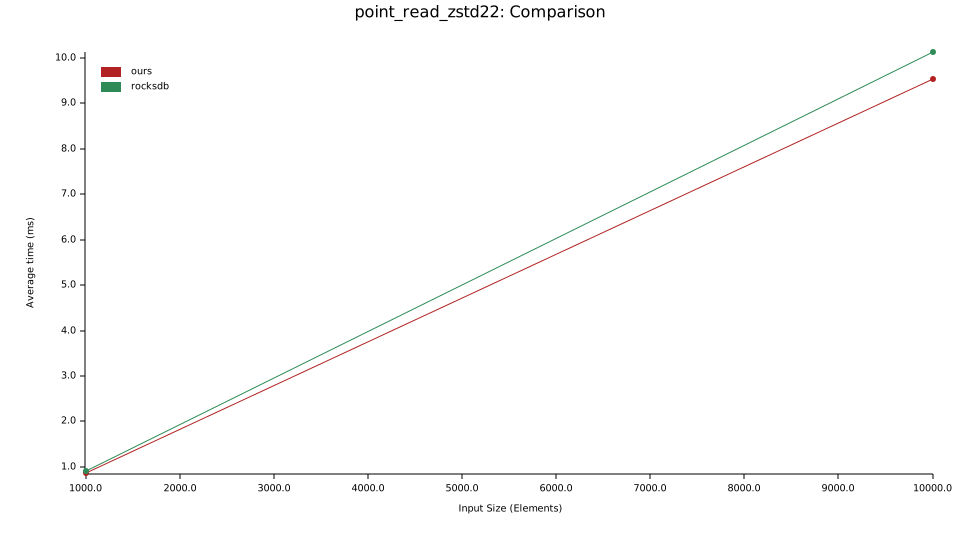
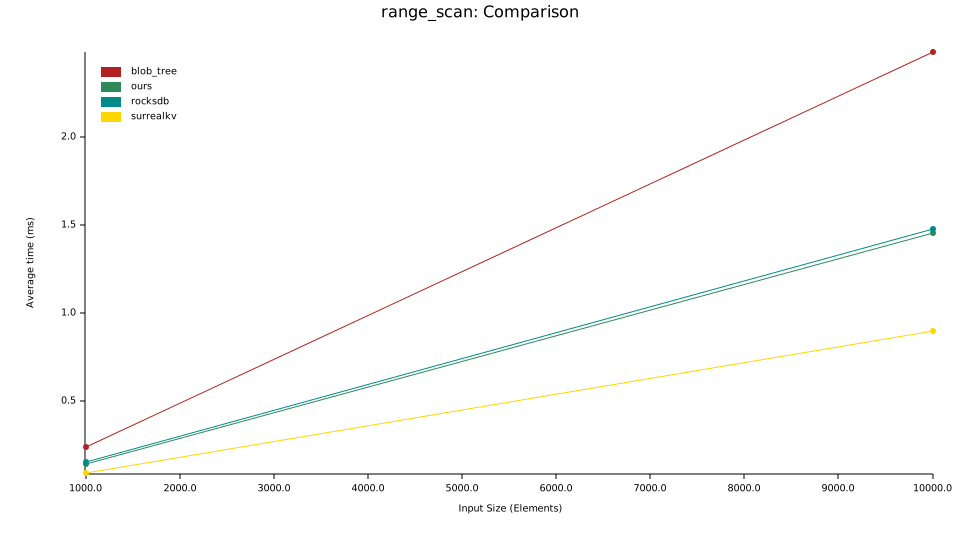
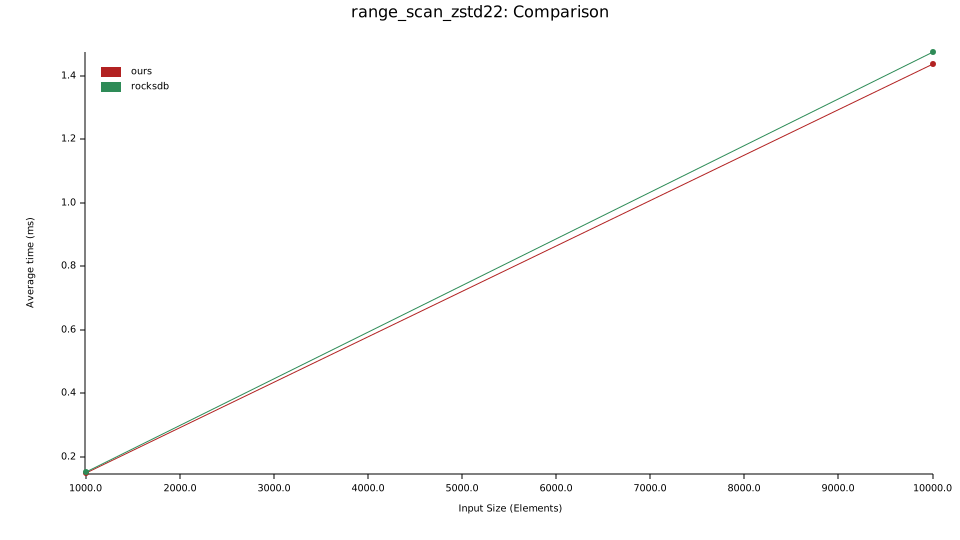
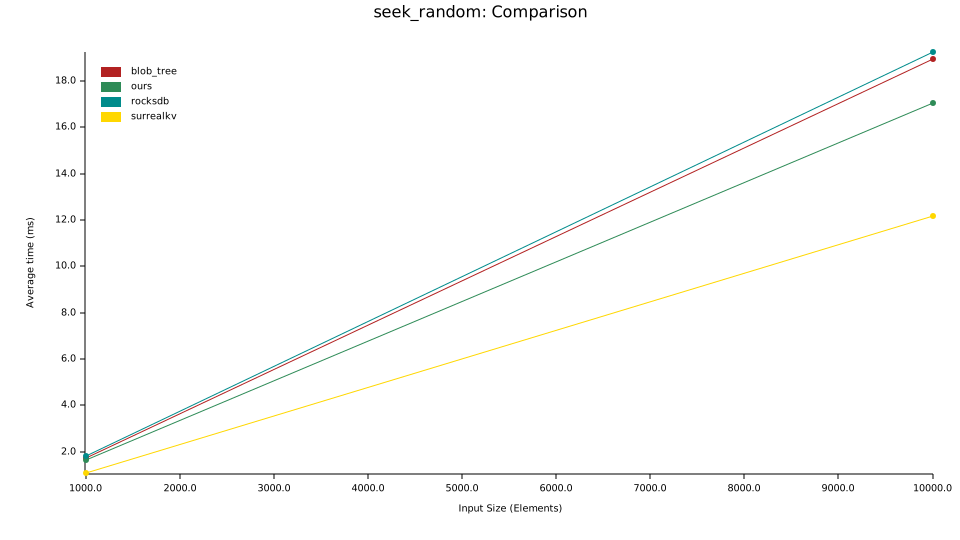
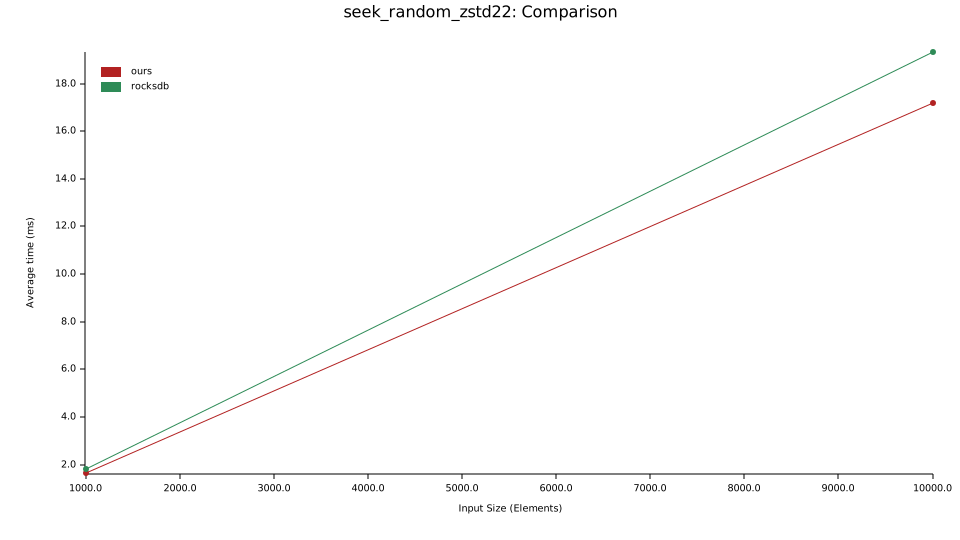
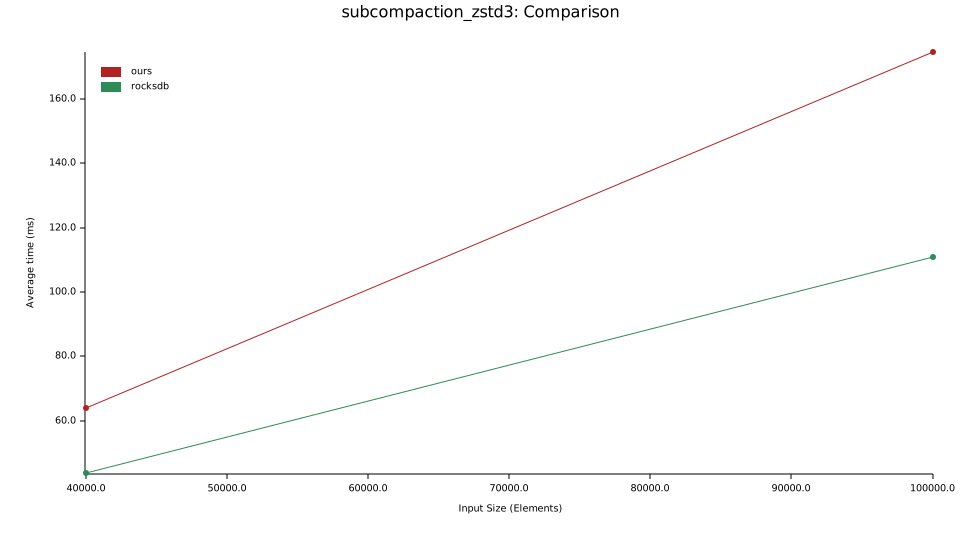
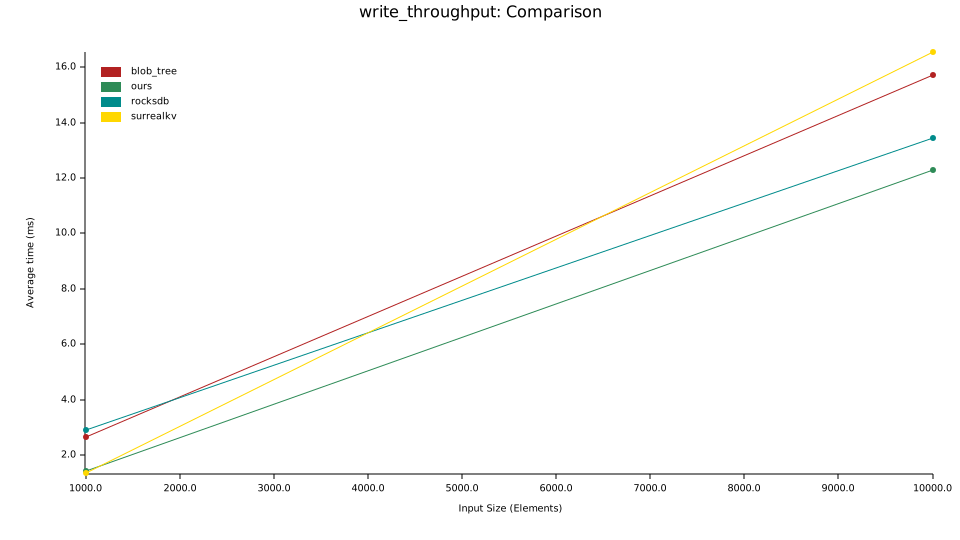
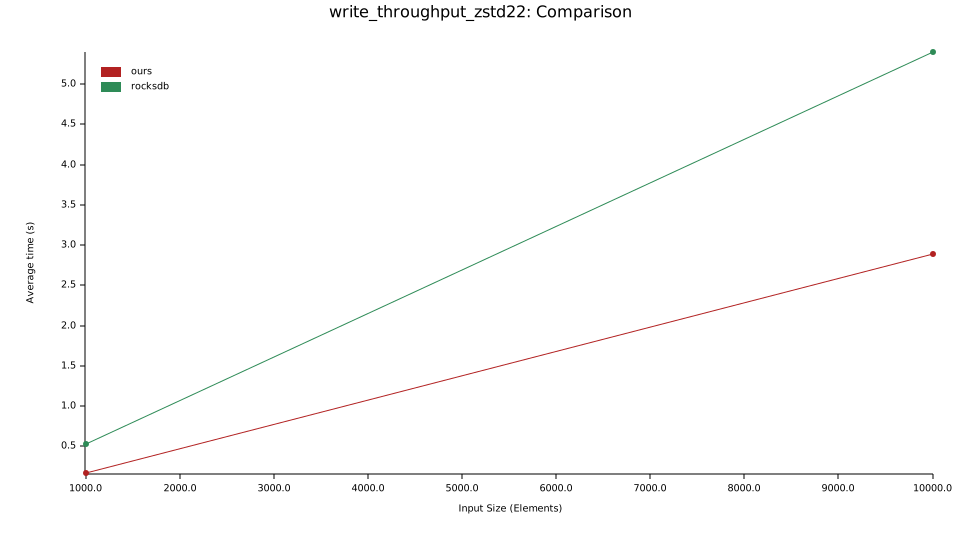
Each chart overlays ours against rocksdb on the
same axes (X = element count, Y = average time; lower is faster). Generated by the
compare-rocksdb harness — both engines run in the same process per scenario.
· single-engine db_bench trend →
· raw criterion index →